Showing posts with label USD/JPY. Show all posts

Tuesday, January 11, 2022

USD/JPY important historic overview

Bellow the scatter diagram of open and close price from 01/01/2016 till today. Very similar and opposing dates as all these years passed a climate of recession, coronavirus, slow and fast economic rhythms of development.  

Scatterplot


The linear regression developed taking open price as unchanged dependent variable with moving highs, lows and eventually the closing price of the day. Very robust data with dates 2016-2020 were selected on proposed.  

Linear Regression

Model Fit Measures
ModelR
10.9980.995


Model Coefficients - Open
PredictorEstimateSEtp
Intercept0.06430.19610.3280.743
High1.00650.016262.154< .001
Low0.70890.015645.579< .001
Close-0.71680.0208-34.425< .001

Assumption Checks

Q-Q Plot


Thursday, November 11, 2021

Do we have a "TOP UP"

 We had many news corresponding this week. Japan October PPI +1.2% m/m (expected +0.4%), US October CPI +6.2% y/y (vs +5.8% expected), Japan's PM Kishida says wants to compile a further economic stimulus package on November 19. All joining the negative side of dollar but yet the yen collapse. Credit Suisse sold us USD/JPY set to soar as high as 123.00 but as the correlation displays the negative trait of USD with strength loosing over time and per stimulus to be issued of Japan's side, we intimating a bear run. We were right of the bear runs at the past, we did not run for bullish corrections as the main trend seems to have change. The yen is a light weight currency taken buy the strong dollar wind.


Friday, October 29, 2021

Descriptive analysis of Yen pair with BTC

The pair of YEN seems to be correlated negative with the rise of Bitcoin. Risky traders prefer to choose on alternative method of investing rather than buying Japan's safe currency. With the scatter plot comparing USD/JPY with Bitcoin linear line has a positive incline with JPY median and mean staying before Bitcoin's. The volatility of cryptocurrency world does not help the standard deviation comparing to Yen of 1.16 having the closing prices near median of 110 which happens to be also the mean.
Descriptives
 USD/JPY CloseBTC CloseUSD/JPY LowUSD/JPY HighBTC LowBTC High
N646464646464
Mean110457321101114414846881
Median110462111101104457547249
Standard deviation1.1663021.071.1360756260
Minimum109298641091092933631004
Maximum114624961141145691662719


Friday, October 22, 2021

Sealed case

It's the final day of the week and the yen settles downwards. Friday today had a welcome surprise with rising CPI helping Japan to rise closer to near 2% inflation aiming. The Bank of Japan monetary policy meeting is on October 27 & 28 will held new Information and There have been rumours of expected forecast downgrades to be included in the new outlook which probably will help the rise of yen pairs. As for Technical analysis we are near a gorge, a move forward means the downfall of USD/JPY bringing back the old resistance of 109-110 level. Zone than occupied more than 10 weeks in the past going side ways.
1h chart of USD/JPY


Thursday, October 21, 2021

On point

USD bulls went to stocks. The currency today dive DXY 93.5, same story with bitcoin 
as 66.5k triggered the down alarm to lose 2.5k from the start of the day. JPY rose as forecasted without any news correlated today. The big highlight of the day was US initial jobless claims 290K versus 300K estimate, a nice welcome drop to unemployment but somehow did not triggered right away the rise of dollar leaving it down 0.02%. Two pictures of correct forecast of the week. 


Tuesday, October 19, 2021

Short USD/JPY

USD seems to be losing strength as well as yen, but the momentum of yen currency push the pair downward. We have multiple tries with dollar fail rally attempts, with bulls keep inconsistent push while short side keep strengthen. Unfortunately today was a quiet day without any economic calendar news thous is possible to see a closing near to open Price. Tomorrow is a totally different thing, I see a rapid downfall of USD/JPY possible to close near 113.5 but this is just a guessing while we have many important news coming tomorrow as can be collaborated with both currencies up and down.
USD/JPY 1D

Wednesday, October 13, 2021

FOMC aftermath

FOMC minutes results: Reductions in the pace of asset purchases, by $10 billion in the case of Treasury securities and $5 billion in the case of agency mortgage-backed securities (MBS)

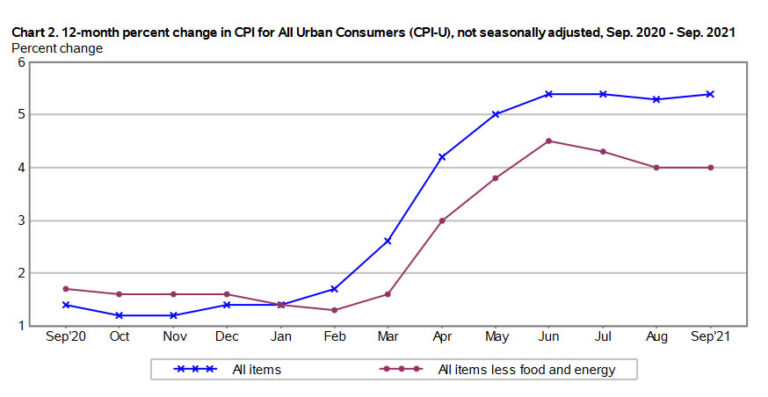
CPI outcome: Core Inflation Rate YoY unchanged 4% and Inflation Rate YoY 5.4% +0.1% more than expected.

Dollar index retreated to 94.1 with fear of inflationary pressures remained high in September helping the equities to rally US500 +0.28% USNDX+0.76%. FOMC showed that it is close to start tapering, possibly in mid-November with hike rates possible at late 2022 or early 2023. 

As predicted, JPY rallied USDJPY: 113.28 -0.27 -0.24%


CPI DATA

Dollar index DXY

JPY rally

This is the first day seeing a JPY rally after from a row of 13 red days. Japanese equities tried the mega squeeze in September, but that is gone. 
"Japanese equities have done nothing since February. The recent excitement was all about the reflation trade happening, but despite the surge in yields, TOPIX has refused bouncing much. The only difference this time around is the fact people have bought into the story..." - themarketear
Moving on, there's CPI report coming 12:00 pm GMT with inflation waiting to be 5.3% and the core one 4%. Today we shall approach using Buy the rumor Sell the news method. This ancient strategy provides not only risk free action but also the power of jumping early at the profits wagon. Getting serious, just avoid placing any orders during pre. news as volatility is low during that hours. The safe bet today is 113.0 - 113.5 for USD/JPY being the zone of expiring options.

Tuesday, October 12, 2021

Sell signal

Yes, I do get a TDI sell signal as Bollinger bands contract waiting for a burst move downwards. Now 09:00 am GMT, both London and European markets open. The move to place a short trade today is risky, I counter offer you to wait for CPI tomorrow Wednesday. The USD/JPY seems to have been settle to 113.5 area. A move up will break towards to 114.17 - 114.5 price zone. The move upwards is limited in compare of the downside which can easy drop to 110.0 who was a immersive support zone. Tomorrow is the big market day. 


The price fluctuates as the longs rose 7.3% today but consumer sentiment favors the short side at the moment with weekly longs dropped by 10.19% according to IG. Fear and energy crisis plays a huge role coming from Evergrande crash delaying the third bond payment. 
Price density areas-Price data-Bollinger bands density-Sentiment


USD/JPY correlated to commodities

The raise of commodities does not justify the weakening of JPY. As the rapid raise of energy markets occur so does the treasury yields and strength of DXY index happens. The up rise of Yen seems to be more correlated to USD rather than commodities. Bellow the USD/JPY pair next to coal and WTI oil. Japan's substantial reliance on imports for fuel, raw materials, and food, domestic industries are equally exposed to higher prices from a weak yen. This is why Japan favors for a strong currency. 
WTI, Coal & USDJPY from Sep 1, 2021 till Oct 12, 2021


A different approach today

We explore the correlation of JPY with the other currencies. As we expect JPY is heavily dependent in coal and oil making it to responds negatively to heavy commodities pairs AUD,CAD and NZD. 

Bellow the two charts, the one with correlations and the other with currency market moves. Do we approach to the AUD & CAD overheat that needs a cooldown? Which currencies do depend more to se a opposite move from them taking the lead afterwards. 
Correlation 
Market glance

Monday, October 11, 2021

USD/JPY trinity

Adding more to USD/JPY weekly stats of DXY/US10YT/USDJPY since 2016 till Oct 2021 here is the graph with DXY/US10YT/USDJPY. As we can see the price correlates better with treasury yields rather than DXY dollar index. Same happens with US10YT and DXY. 
USD/JPY with US10YT and DXY 

1H currency strength index

As forecasted, bull momentum skyrocketed USD/JPY in Asian/early Europe session. The close will be near open or higher? The retrace to 50% waits for Wednesday's CPI or Friday's retail sales. 

Todays support and resistance seems to have been form. 
Resistance: 113.863 - 112.064 - 111.694 - 110.465
Support: 109.187 - 108.496 - 107.617 - 104.732

Sunday, October 10, 2021

Start of the week with USD/JPY point of view

Its before 8am in New Zealand, and as is usual for a Monday morning, market liquidity is light. Some small change from late Friday levels with USD/JPY dropping slightly to 112.14

Pair rose as the bullish push from nonfarm payrolls was massive. The data did not cope (expecting higher stats) and the funds didn't dump treasury yields with S&P closing lower pushing all along the USD currency. 

Asian and Europe session expects to have the most volatility and volume today as US Columbus day and Thanksgiving for CAD will drop the liquidity later on. We expecting a correction to 23.6% 111.475 or 38.2% today 111.000 but the first move of the day will push the price a little higher as bullish momentum of Friday kept the currency idea upwards. The close will be near open price or somewhat lower. 

USD/JPY weekly stats of DXY/US10YT/USDJPY since 2016 till Oct 2021

The tables of Descriptive analysis and correlation of US dollar index, 10 year treasury yields and USD/JPY weekly close data. 

Descriptives

Descriptives
 DXYPriceDGS10
N301301301
Missing000
Mean95.51091.94
Median95.71101.91
Standard deviation3.173.470.707
Minimum89.11000.550
Maximum1031213.21

Correlation Matrix

Correlation Matrix
  DXYPriceDGS10
DXYPearson's r  
 p-value  
PricePearson's r0.344 
 p-value< .001 
DGS10Pearson's r0.0840.536
 p-value0.147< .001
Bonus: correlation plot with density graph 

Friday, October 8, 2021

10-year Treasury yields importance today

10-year yields adds another 2 bps today to 1.59% and close to cross the 1.60% mark a technical area of last month breakout. My point of view is that bond sellers will go after profit taking, distribution and a mark-down activity. All that depends a lot on what the US nonfarm payrolls release will be later today.

Scatterplot of US10Y 2016 weekly till today correlated with weekly's close price:

Monday, October 4, 2021

US session forecast results

USD/JPY 1h graph displaying US opening


USD/JPY EU session: Bullish 
USD US session: Bearish 

Forecast was correct, the pair dropped after climbing 23.6% retracement 111.37 price point. 
Next target 111.0 and below zone. 

Overall point of view seems that's possible to close higher that 1 Oct as price stuck between 100 and 200 hour moving average. 

USD/JPY US session, Monday 4,Oct 2021

Past week we witness a huge ramp up of USD treasury yields as results the skyrocket of USD pair. JPY went vulnerable after Fumio Kishida takes office as Japan's new Prime Minister. USD/JPY manage to climb high as 112.078 (a Feb 2020 price area) ringing the bell looking for a better safe alternative (currently USD) as the grow of commodities and the linked currencies make them better alternative displacing CHF and JPY. Wait for mid October or 2W/9M price action to see a opposite move or small rally.

Moreover the correlation of JPY with S&P 500 we saw a late week move up as equities rose 30 Sep and 1 Oct. For instance, while a case can be made that the JPY shouldn’t be a safe haven currency, it behaves as one. When S&P500 weakens, the pair historically tends to drop (above chart based on weekly data since January 2000). Nordea


The area of the currency vary between 111.3 and 110.88. Asia kept JPY high with toping 111.15 and closing 110.97. Early Europe session rose the pair up to previous weekly close retesting the 23.6% retracement. US start seems to be a firm one as there isn't any significant news coming today. Equalities shall engrave the course of price action expecting to rise opposing treasury yield 14.65 slope (- 4.19% down today). The close of US market looks to be a loss for USD currencies but a green day for the pair, high fiving 112.0 price point giving the first clue for the pending mini retrace aiming to 50% mark 110.570.

Option expire: 111.25 (550m) 112.20(450m) 
Pivot points: R3 111.81 R2 111.55 R1 111.40 PP 111.14 S1 111.00 S2 110.74 S3 110.59
Price distribution between Bollinger band:


Popular Posts: